Pushing Boulders Across the Network
$JOB was struggling with metrics. OpenTSDB was slow, hiccup-y, hard to maintain, and the query language was fairly inflexible. I’ve written about this in the past; and I’ve written about the tech we landed on to replace it. But an interesting aspect of our migration was how we moved our incoming stream of data…
When we initially set up our metrics pipeline, we intentionally added Kafka into the path. It gave us a great “network buffer” to ensure failures in our ingest systems wouldn’t affect user’s actual data. Because OpenTSDB has a built-in Kafka RPC adapter, this was easy to leverage. And fairly fast. We were consuming somewhere around 750k points/sec at OpenTSDB’s height.
Because of this, any system we switched to needed a way to consume data pushed from Kafka. After doing some work with a number of different tools on the market (telegraf, vector, benthos…), we discovered that some of the challenges our particular migration had weren’t really met by anything currently on the market. But writing something new isn’t always a great idea. What were the requirements we needed and why was writing something the best solution?
Requirements
- Consume data from Kafka
- Since we were already writing data through Kafka, it makes sense to have any new tool start by consuming that “firehose”.
- Route to multiple endpoints (tenants/clusters/etc.)
- This is actually an extention of what OpenTSDB could do, but we knew it would be useful
- Ensure output data is Prometheus compatible
- Because one of our hard requirements for the new system was PromQL compatibility, we needed all metrics written to the system to work with PromQL
- Address single value stats
- This is complicated. But basically…some ingest systems submit single values in different ways
- More detail is available later
- Have a good dead letter queue
- Failed writes shouldn’t be dropped on the floor. They should be sent somewhere for analysis and reprocessing
- Kafka’s a great place for this!
- Simple deployment
- Ideally we’ll need to push a binary and a config file
- Fast and lightweight
- Our current system processes ~750k points/sec. Anything we replace that with needs to be able to handle at least that much traffic
There are tools like Confluent’s Kafka Connect and Apache Nifi that could accomplish this, but we’re trying to avoid operational complexity where possible, so adding additional Java projects (and all their potential dependencies) isn’t ideal.
Solution
So when existing solutions don’t work…you write something! I had written some Go in the past and, given there were good libraries for reading from Kafka and writing to Influx available in Go, I knew the hard parts of the solution were already solved.
We ended up with Sisyphus: https://github.com/datto/sisyphus
Generally speaking, sisyphus is very simple. It reads data from Kafka, validates it, and batch writes it to an InfluxDB v2 endpoint.
More information about handling single field values is here: https://github.com/datto/sisyphus#flip_single_fields
Success
Because sisyphus could consume the exact same incoming stream that OpenTSDB was consuming, we could easily migrate users between the systems as time (and their focus) permitted. And because all the data was being piped through Kafka, we could easily set up a bifurcated stream of data flowing to both systems. This meant that as users were migrated, they already had months of usable data in our new system. So while sisyphus keeps trying to drain Kafka of all incoming messages, our VictoriaMetrics install has topped 1 million point/sec.
Some pretty graphs
What would a story about metric consumption be without graphs?
Here’s Sisyphus consuming all of $JOB’s incoming metrics:
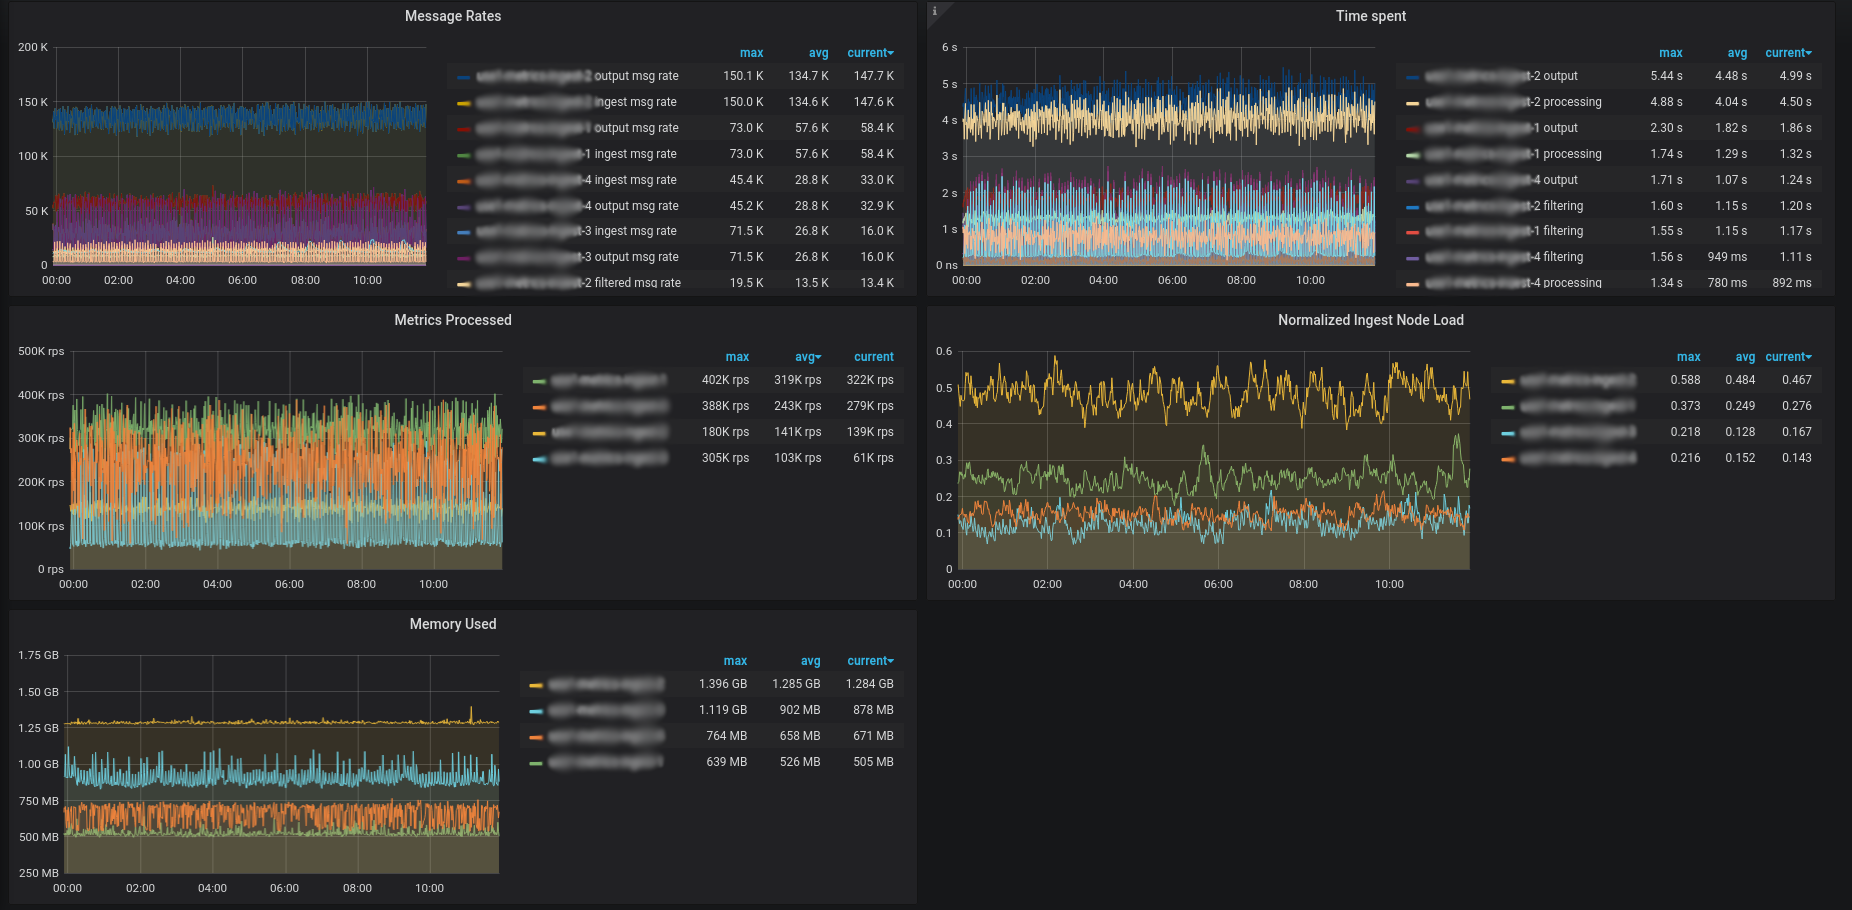
We can see we’re doing all our processing on 4 nodes. The same ingest into OpenTSDB actually required ~27 nodes to perform as well.